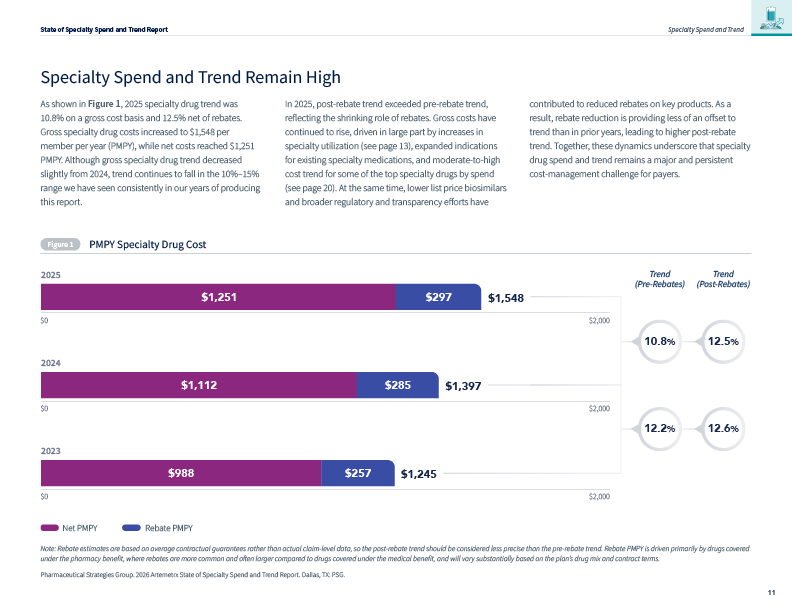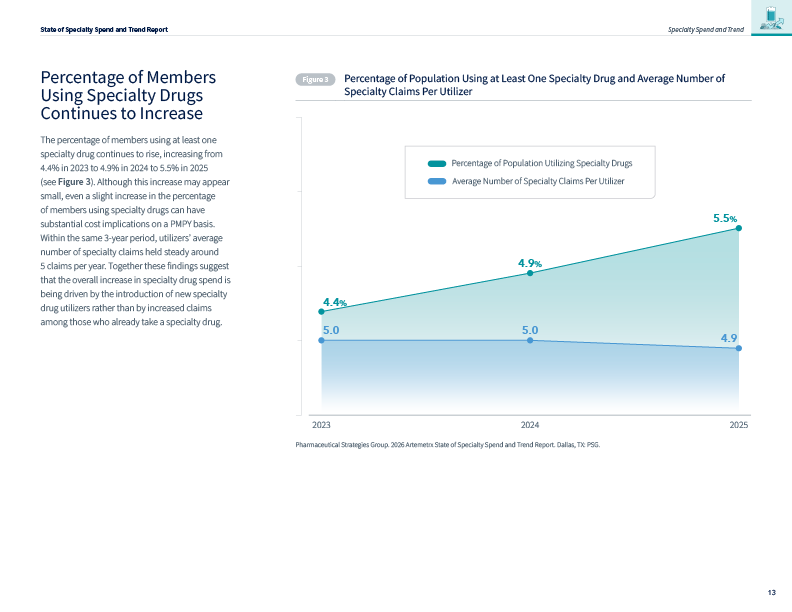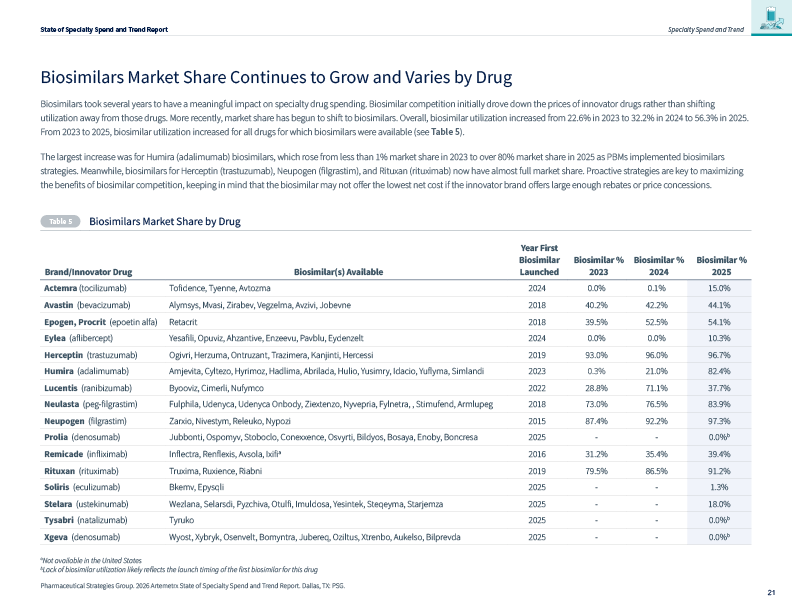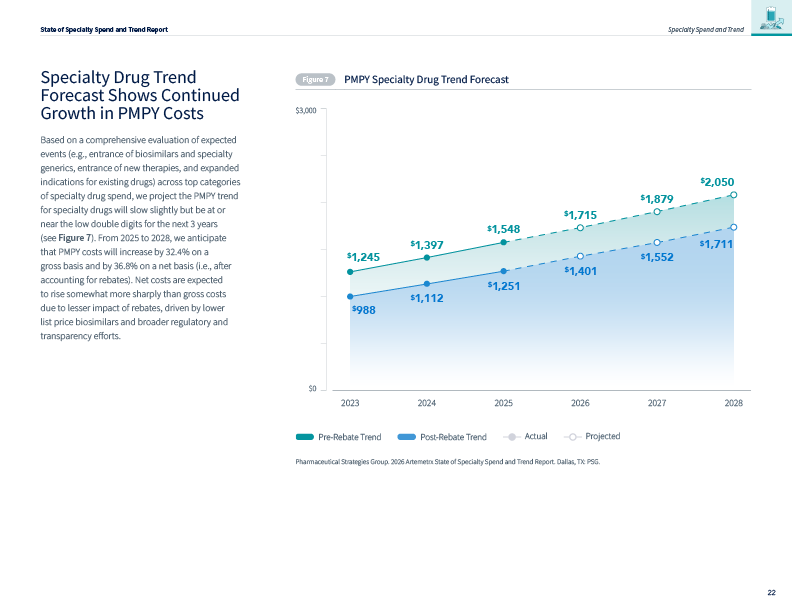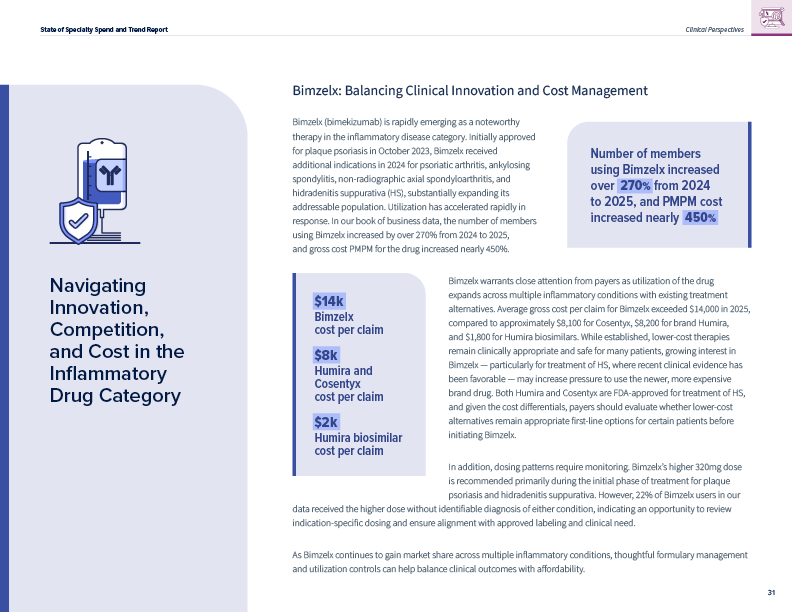

Where the 2026 Artemetrx State of Specialty Spend and Trend Report focuses on specialty drug utilization from both pharmacy and medical claims data, this supplement to the report details spend and trend for specialty and non-specialty drugs covered under the pharmacy benefit.
As the findings highlight, while specialty drugs are much more costly on a per claim basis, non-specialty drugs continue to make up nearly half of total pharmacy spend. Additionally, specialty and non-specialty trend drivers vary and are important for payers to understand as they evaluate and implement coverage and utilization management strategies.
Download the report supplement to learn more!
Key Findings
- Specialty vs. Non-Specialty Pharmacy Spend: Specialty and non-specialty drugs each accounted for roughly half of pharmacy spend, even though the average specialty claim cost more than 80 times as much as a non-specialty claim on a gross cost basis.
- Drivers of Pharmacy Trend: Specialty and non-specialty drugs had nearly equal gross costs trends (just over 10%), but trend drivers differed — claim utilization drove specialty pharmacy trend, while non-specialty pharmacy trend was split almost evenly between utilization and cost per claim.
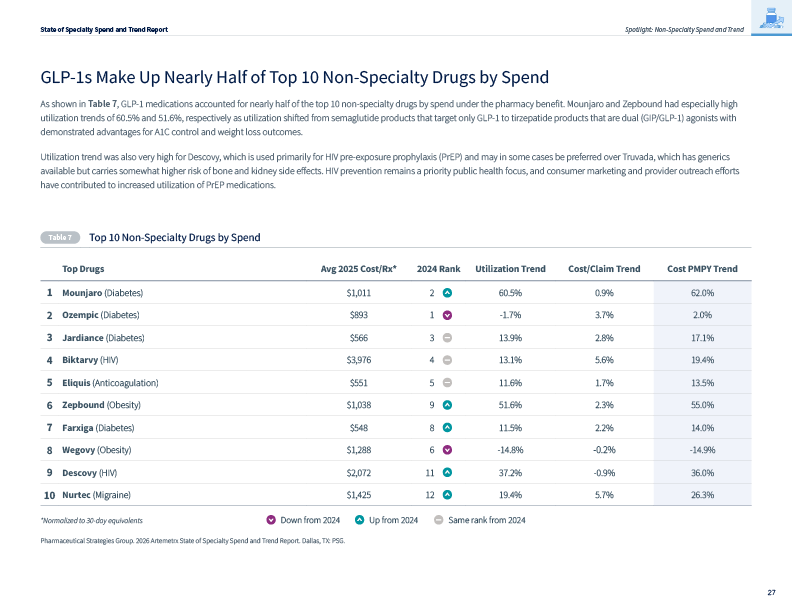
- Top Categories by Spend: Inflammatory disorder and diabetes were the top two categories by spend in pharmacy, combining to account for nearly 40% of pharmacy spend.
- Top Drugs by Spend: Mounjaro was the #1 pharmacy drug by spend, driven by a 60.5% utilization trend, and 9 of the top 10 drugs came from the diabetes or inflammatory disorder categories.