Outliers: Applying math to identify and manage outliers in data
Posted on April 1, 2021
High-cost patients, high-cost claims, and other outliers can challenge even the most sophisticated payers and plan sponsors. Knowing today’s outliers will not help you get ahead of what is coming tomorrow. How do you get ahead of costly outliers? The answer is math.
I may be the outlier because I love math and am even a certified mathematician. My math degree did more than teach me how to solve complex algebraic formulas and write theories. It taught me how to solve problems systematically.
That is how we approach solving the problem of identifying and predicting high-cost outliers within medication utilization. To truly maximize the management of outliers, you need to be able to:
- Leverage scalability
- Apply algorithms
- Use a streamlined approach
- Incorporate predictive capabilities
Using math on data allows for the creation of repeatable algorithms to identify outliers in your data. The next step is to have a strong and forward-looking strategy to ensure the ongoing effective identification of outliers and a plan on what to do with them.
Let’s talk about three real-world examples of outliers.
What do these three things have in common?
Example 1 – Medical Drug Reimbursement
As a payer or plan sponsor is sifting through complex medical data to determine reimbursement for their home infusion drugs. The organization observes the costs for most of the drugs fall within the expected range, except for one drug.
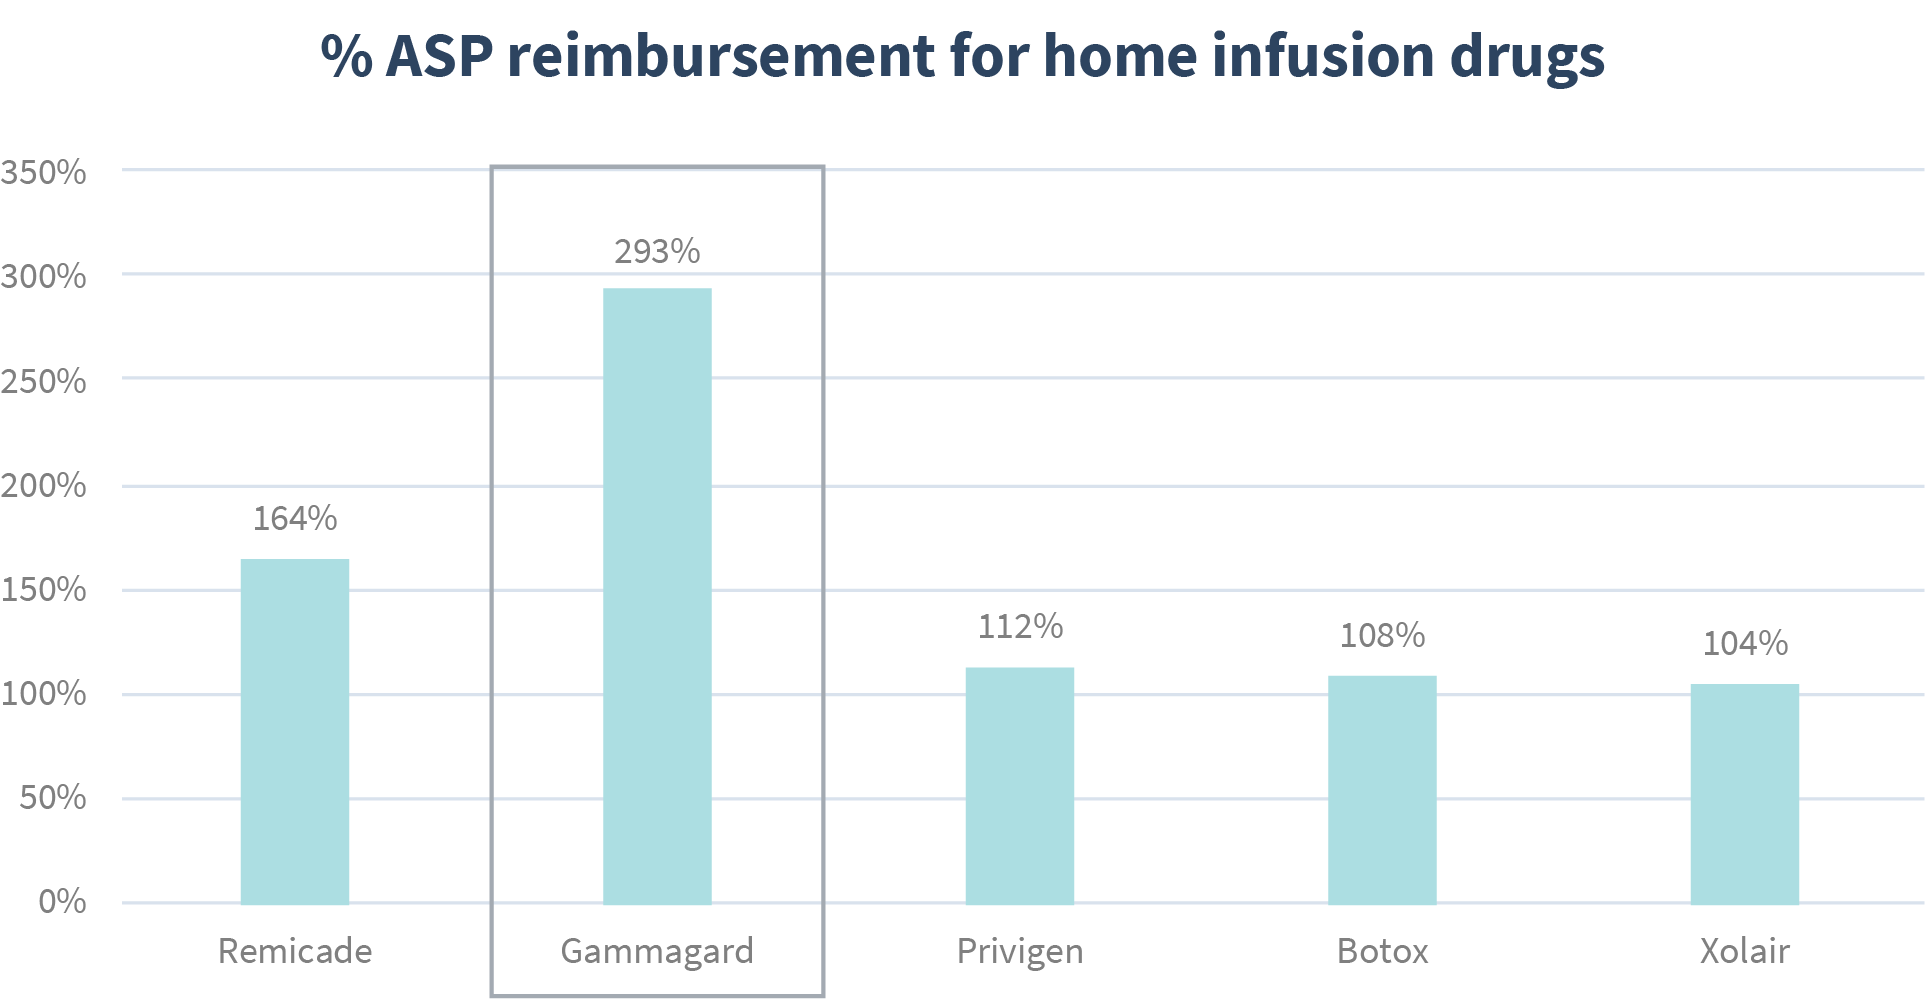
The data for one drug, Gammagard, is well out of range. Those examining the data not only question how to identify but how to use such information. After taking a closer look at the reimbursement for this drug, you can see a high level of variability amongst the different home infusion providers.
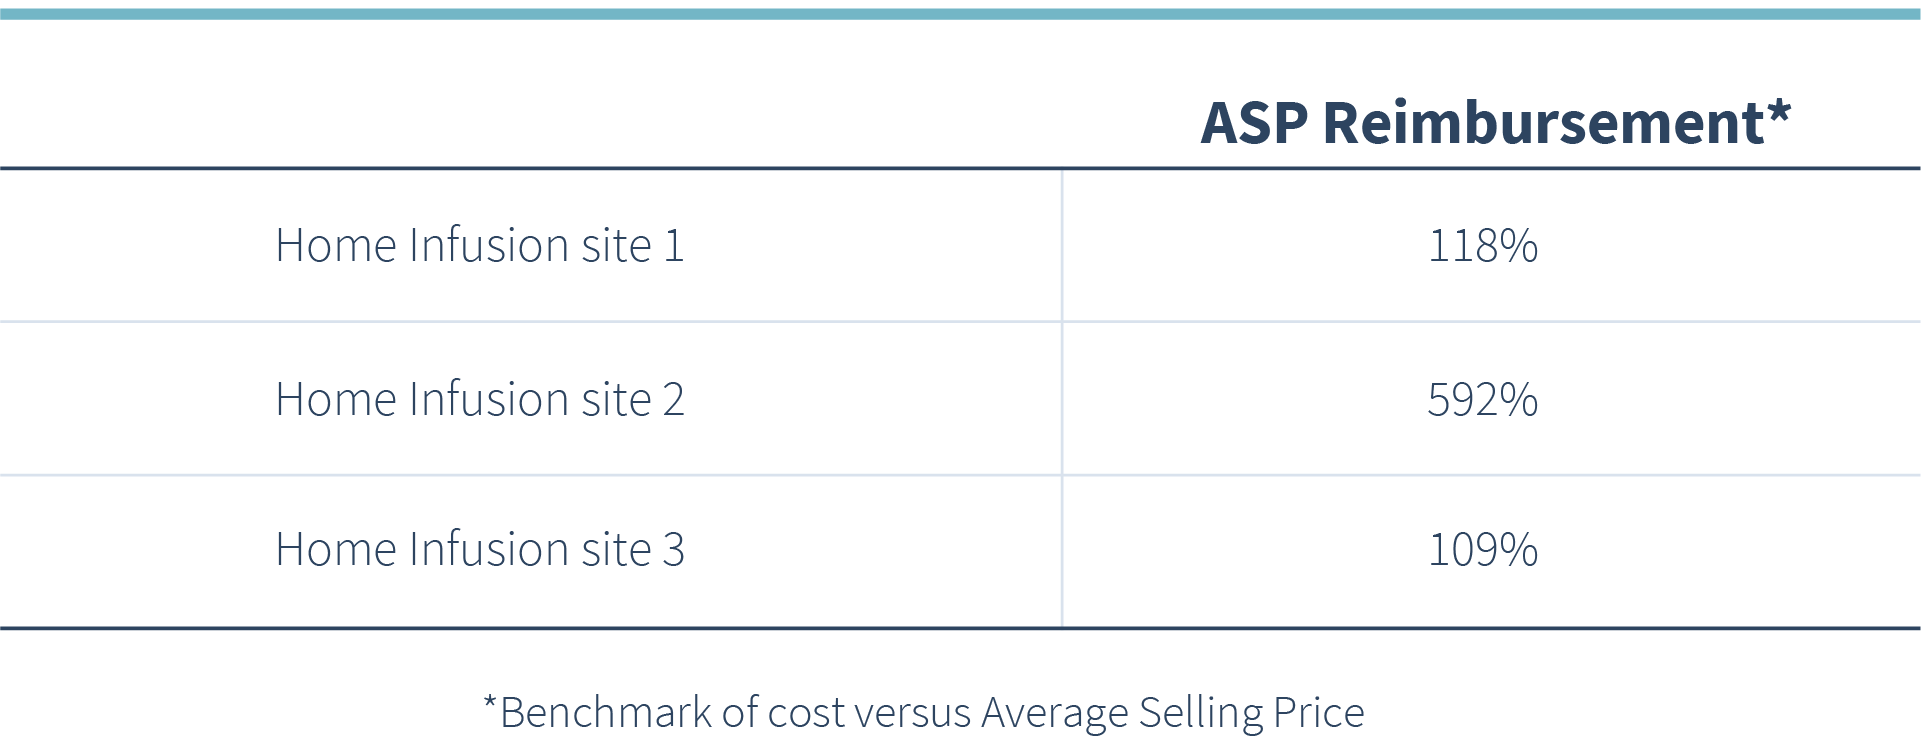
In this example, one potential next step would be shifting utilization to a lower-cost home infusion site reducing overall cost. Another option may be to renegotiate the contract with the higher-cost site. Math allows us to normalize the data to compare alternatives accurately.
Example 2 – Fraud, Waste, & Abuse (FWA)
There are thousands of medications on the market with all different appropriate dosing guidelines. Some are appropriate to take daily, others monthly, and so on. Again, we normalize the data through math to assess whether the quantity of medications dispensed is appropriate based on the individual drug and even the patient dynamics such as diagnosis code. By regularly ingesting and analyzing data based on these algorithms, we can identify and alert when a utilization pattern is outside of what would be expected.
That is what happened in this next example. A patient received four bottles per day of eye drops, whereas we would normally expect a bottle every two weeks. Even more alarming, the prescriber was a podiatrist. The optics were not good for this foot doctor—pun intended.
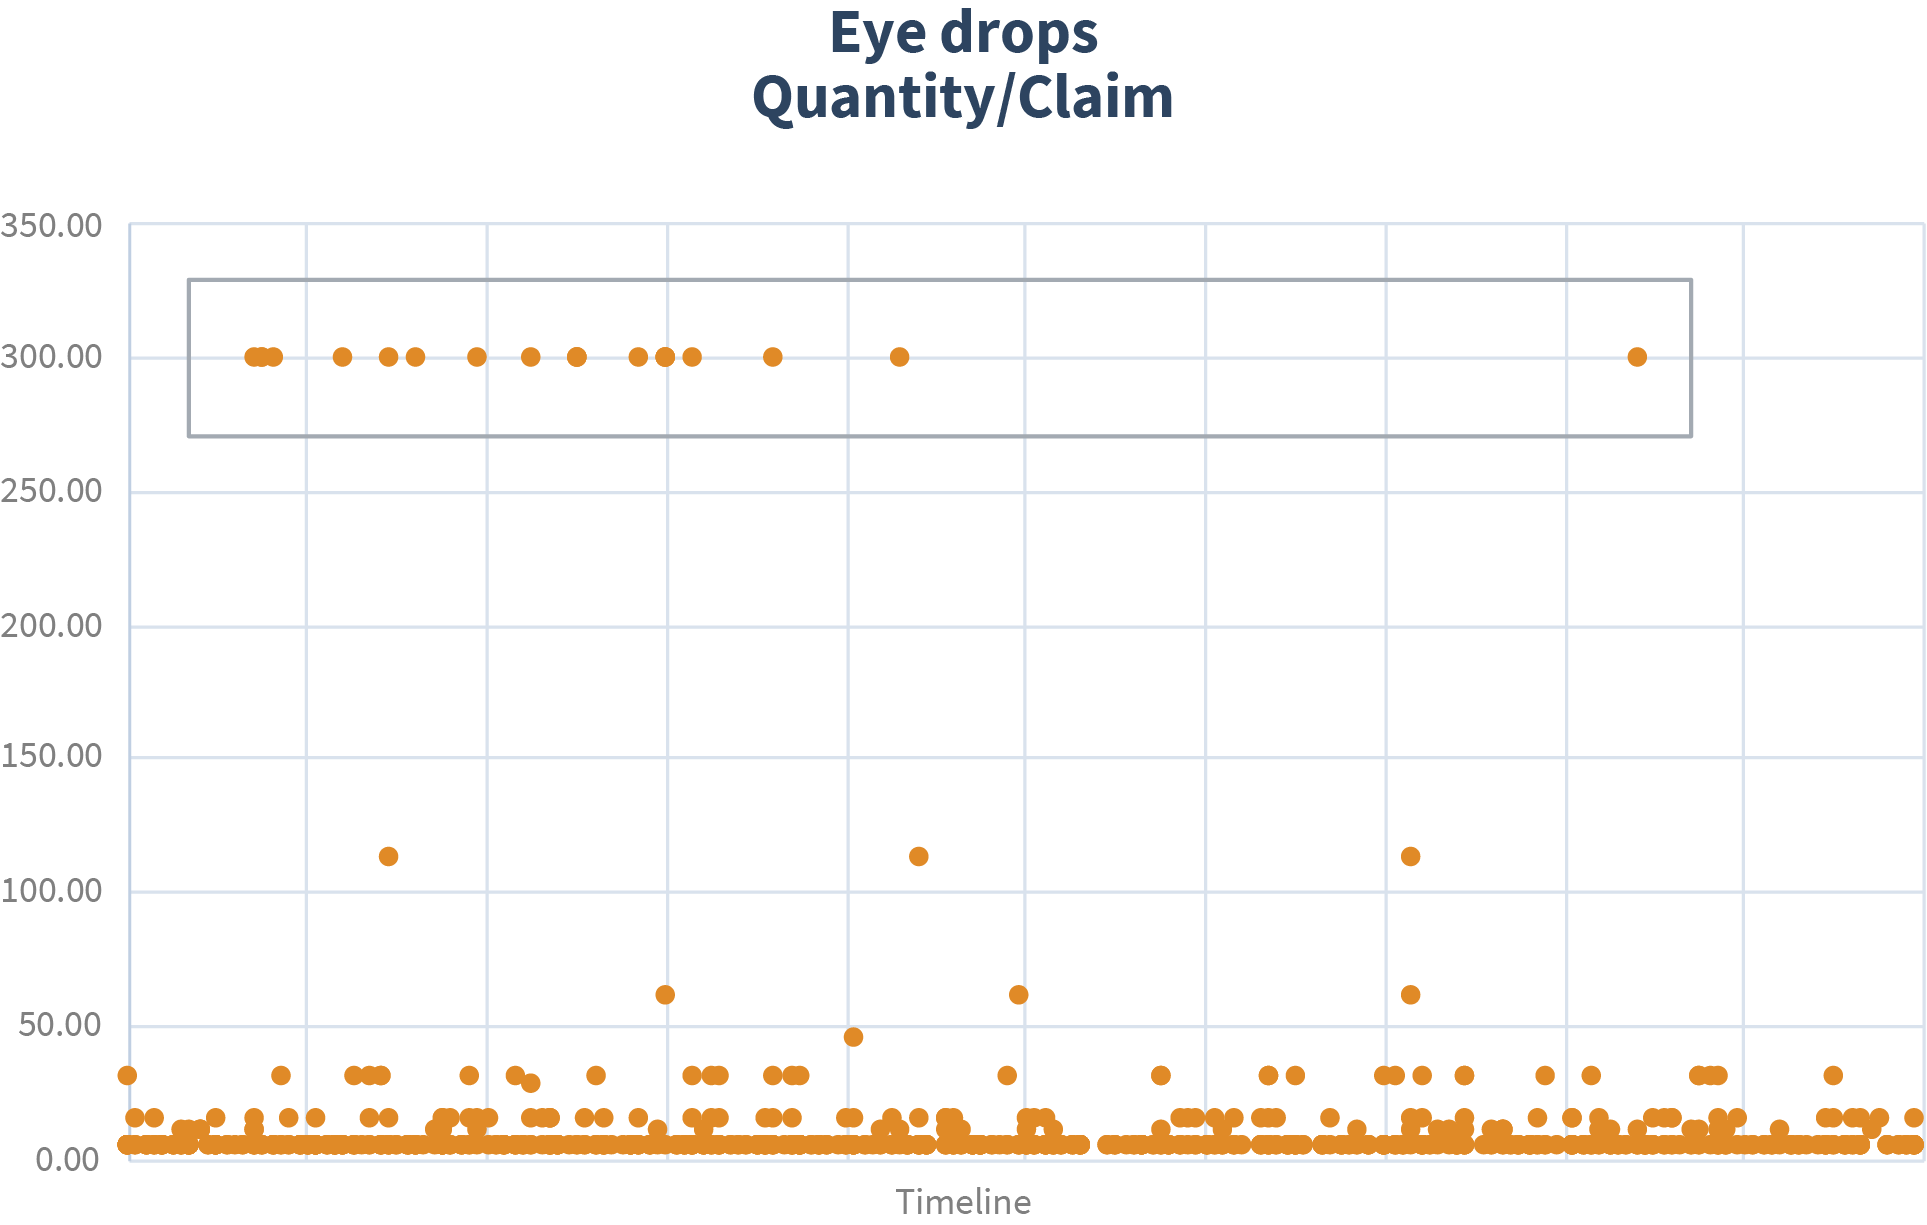
The pressing question becomes, what do you do about it? In this example, the solution was to adjust the quantity level limit and add this to the suspicious drug and prescriber report.
Example 3 – Total Cost of Care
Medications are costly but can be critical in controlling diseases such as diabetes and reducing the total cost of care. Care for people with diabetes accounts for 25 percent of the national health care dollars in the US, according to the American Diabetes Association (ADA). Consequently, ensuring members with diabetes are appropriately managed is on everyone’s radar.
How can a payer or plan sponsor integrate diabetes data to optimize therapy, improve patient outcomes, and flag drugs experiencing cost changes?
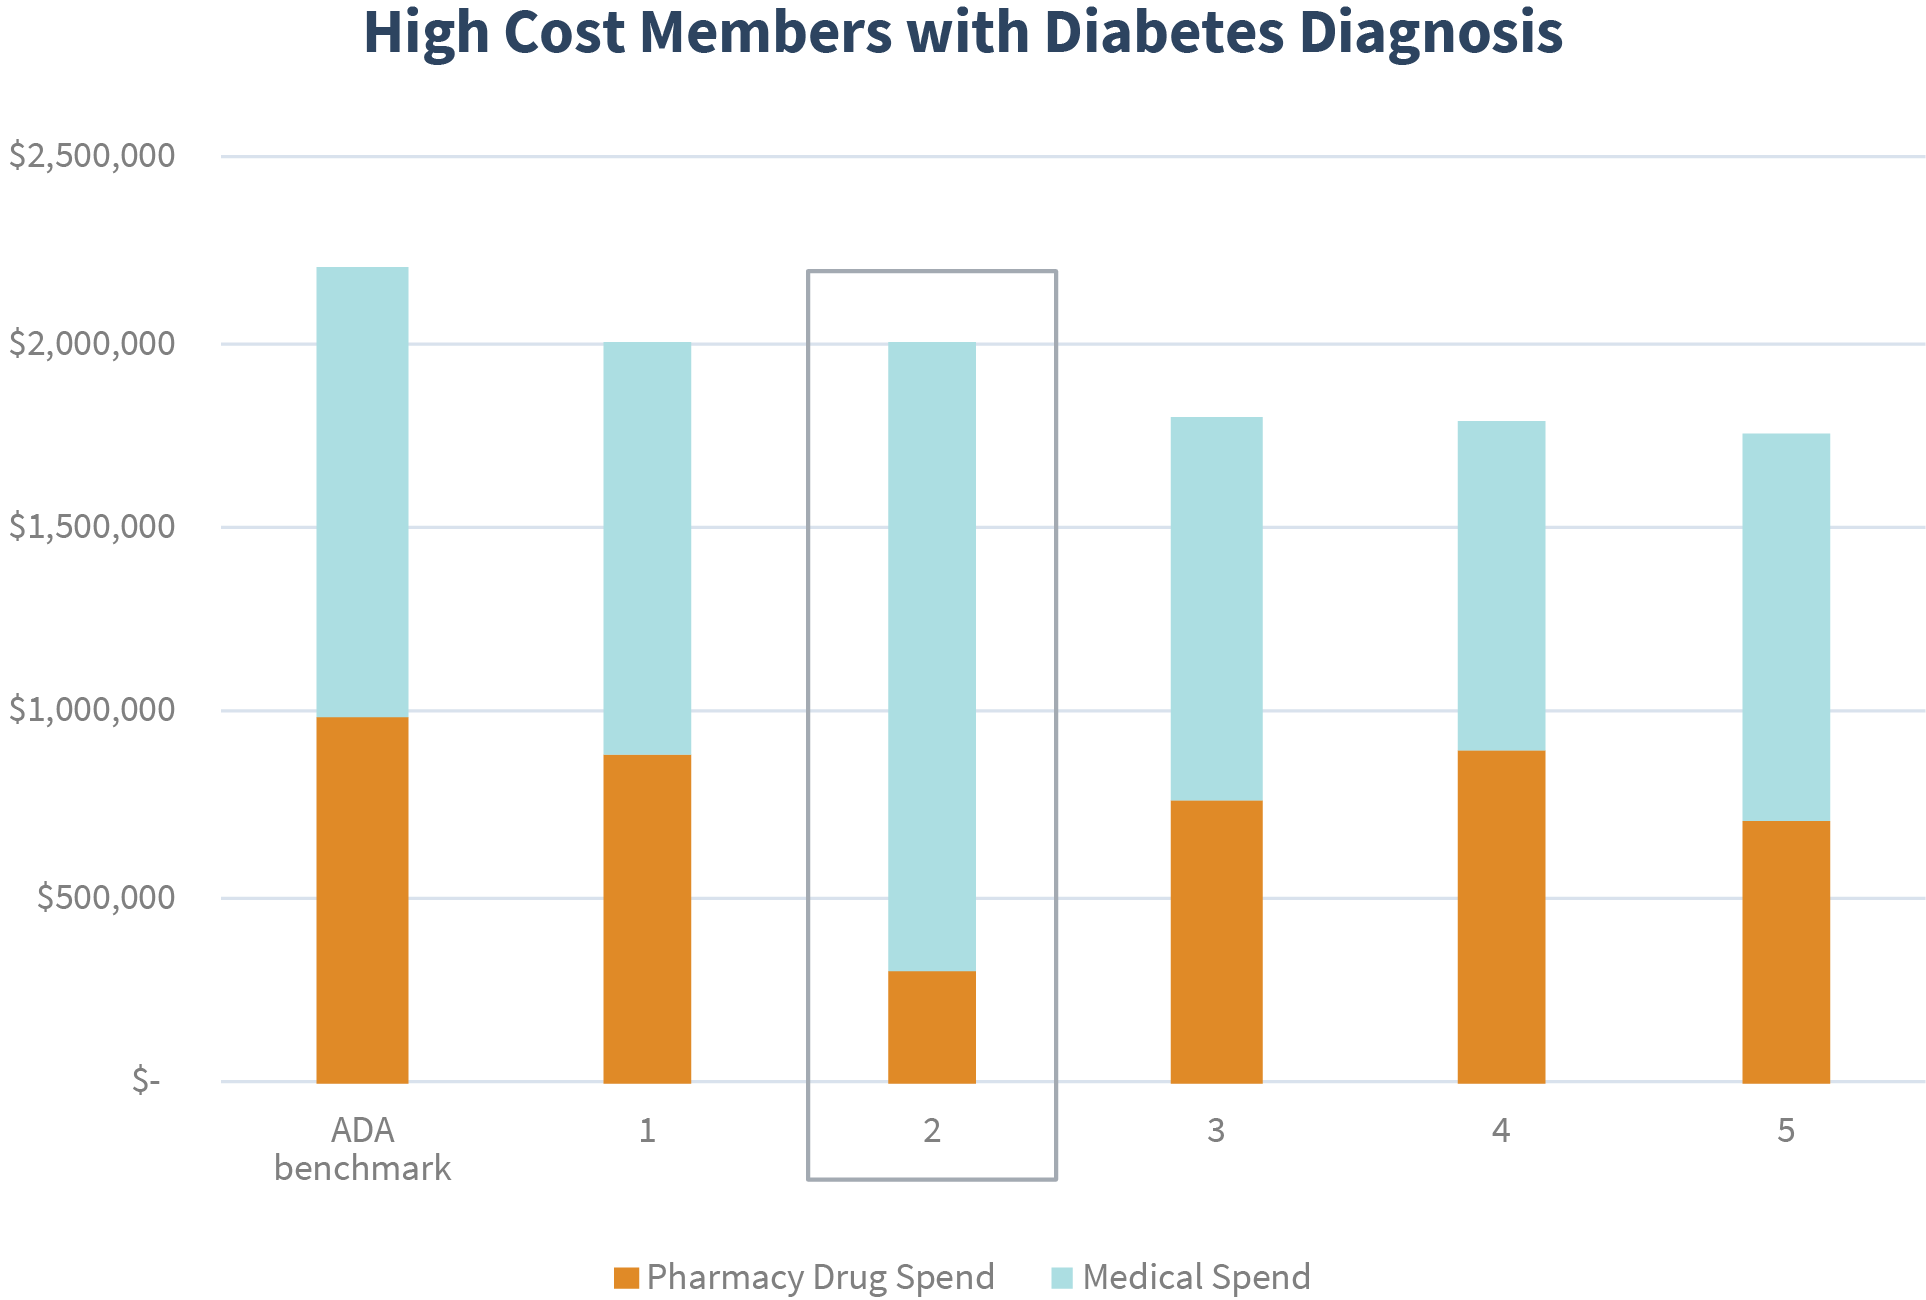
In this example, we see a patient with abnormally high medical spend and relatively low pharmacy spend when compared to peers and ADA benchmark data. This outlier indicates a potential need for optimized therapy that could produce better patient outcomes.
These three examples have something in common beyond math. They highlight the use of both pharmacy and medical data in drug management. Medical data is less standardized and more difficult to analyze for medication management than pharmacy data, but just as important. While each example and the corresponding question is different, the answer to each question is markedly similar. The solution lies in the application of math to identify and manage outliers within data.
Medical and pharmacy data is increasingly essential to the administration and the economics of healthcare. It provides valuable knowledge that can improve clinical and financial outcomes. Outliers refer to data points discretely different and separate from the rest of relevant data in the simplest definition. In other words, outliers may refer to data anomalies, which can identify trends and opportunities for improvement within payer and plan sponsor organizations.
Applying math to identify and manage outliers within data can be crucial to administering safe and effective drug management. It can help identify potential medication fraud, waste, and abuse incidents, flag drugs experiencing changes in cost, and ensure the best patient outcomes.
