Highlights from the 2019 PBMI Trends in Specialty Drug Benefits Report: Specialty Drug Benefits by the Numbers
Posted on April 9, 2019
For the last eight years, PSG’s Pharmacy Benefit Management Institute (PBMI) has produced original research focused on specialty drug benefit designs used by employers, unions, and commercial health plans across the country. The management of specialty drug costs has been the number one priority for plan sponsors every year since we have been conducting this research.
Five key numbers might help explain why –
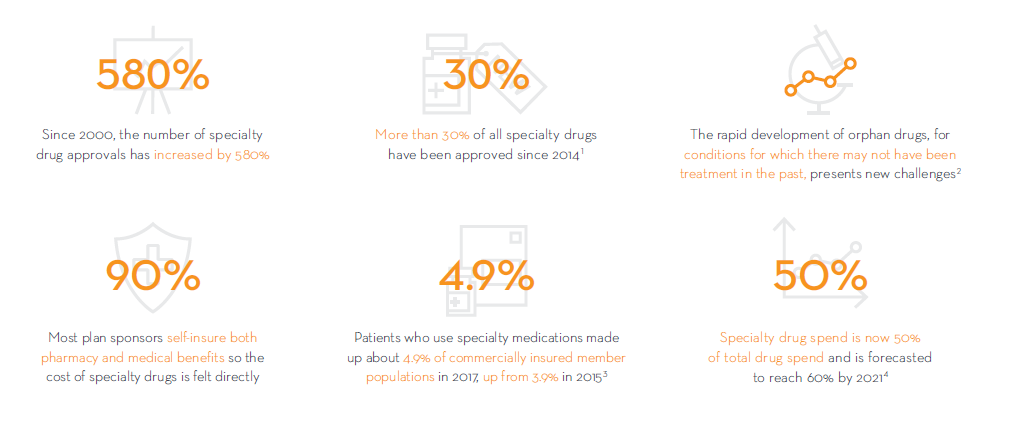
- 90% – Most plan sponsors self-insure both pharmacy and medical benefits, so the cost of specialty drugs is felt directly
- 50% – Specialty drug spend is now 50% of total drug spend and is forecasted to reach 60% by 2021[1]
- 9% – Patients who use specialty medications made up about 4.9% of commercially-insured member populations in 2017, up from 3.9% in 2015[2]
- 580% – Since 2000, the number of specialty drug approvals has increased by 580%
- 30% – More than 30% of all specialty drugs currently on the market have been approved since 2014[3]
What does this mean for plan sponsors? From a cost perspective, 4.9% of their members are responsible for half of all drug spending. This leaves the other half for the remaining 95.1% of members. And, this is before medical costs which are typically higher for members who use specialty drugs.
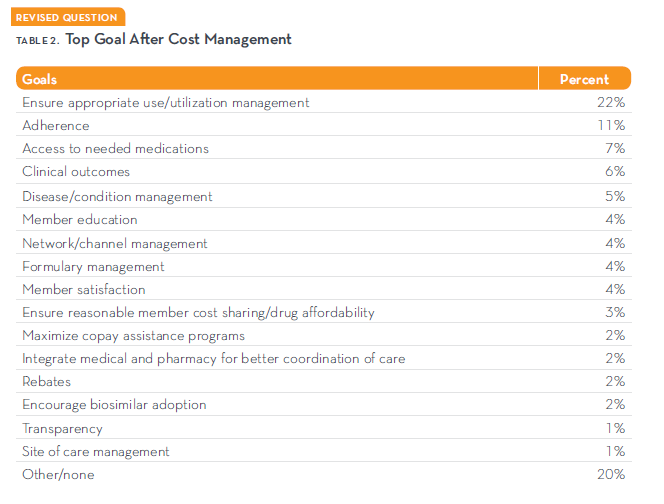
Specialty drug management is not all about drug cost management, however. Plan sponsors also have other goals such as ensuring appropriate use of medication (22%), adherence to medications (11%), ensuring access to medication (7%), and achieving clinical outcomes (6%). Achieving these goals will not be easy, especially in the rapidly growing specialty drug space but we must work together to do so. I hope you will join PBMI in the conversation about how we can do that together.
For more details on other trends in specialty drug management, download your free copy of the report at www.pbmi.com/specialtyreports.
In our next blog post in this series, I’ll discuss the balancing act plan sponsors face with drug benefit design.
[1] Prime Therapeutics. The Inevitable Increase in Specialty Growth. November 14, 2017. https://www.primetherapeutics.com/en/news/prime-insights/2017-insights/insights-specialty-infographic.html.
[2] Pharmaceutical Strategies Group. Artemetrx State of Specialty Spend and Trend, 2017 Results. September 2018. https://www.psgconsults.com/specialtyreport/?gclid=EAIaIQobChMIpqyWoZHl3QIVkAFpCh19eQBrEAAYASAAEgIrlfD_BwE.
[3] RJ Health Systems. Trends in FDA Approvals of Specialty Drugs 1990 through 2017. December 15, 2017. http://rjhealth.com/2017/12/15/trends-fda-approval-specialty-drugs-1990-q3-2017/.
